On this page
Registrations
A breakdown by financial quarter and jurisdiction is displayed in Table 1.
Table 1: Registration summary
| Jurisdiction |
FY 23–24 |
FY 24–25 |
Q1 25–26 |
Q2 25–26 |
Q3 25–26 |
Total |
|---|---|---|---|---|---|---|
| Australian Capital Territory |
405 |
260 |
62 |
76 |
63 |
866 |
| New South Wales |
8,055 |
5,943 |
1,485 |
1,649 |
1,469 |
18,601 |
| Northern Territory |
188 |
176 |
31 |
42 |
42 |
479 |
| Queensland |
5,236 |
3,908 |
934 |
1,130 |
1,102 |
12,310 |
| South Australia |
1,612 |
1,195 |
297 |
349 |
355 |
3,808 |
| Tasmania |
634 |
474 |
124 |
154 |
114 |
1,500 |
| Victoria |
7,020 |
4,997 |
1,147 |
1,535 |
1,364 |
16,063 |
| Western Australia |
2,822 |
1,916 |
461 |
542 |
462 |
6,203 |
| Total |
25,972 |
18,869 |
4,541 |
5,477 |
4,971 |
59,830 |
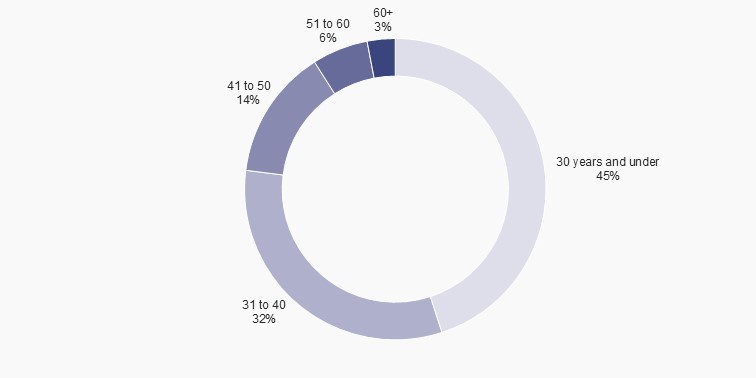
Age of registrants
Figure 1 provides a breakdown of registrants by age group.
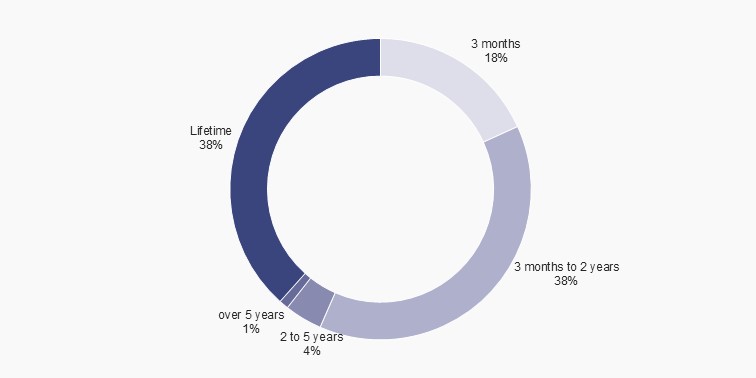
Exclusion periods
Figure 2 provides a breakdown of the length of exclusion that registrants have chosen.