On this page
Registrations
A breakdown by financial quarter and jurisdiction is displayed in Table 1.
Table 1: Registration summary
| Jurisdiction |
FY 23-24 |
FY 24-25 |
Q1 25-26 |
Q2 25-26 |
Total |
|---|---|---|---|---|---|
| Australian Capital Territory |
405 |
260 |
62 |
76 |
803 |
| New South Wales |
8,055 |
5,943 |
1,485 |
1,649 |
17,132 |
| Northern Territory |
188 |
176 |
31 |
42 |
437 |
| Queensland |
5,236 |
3,908 |
934 |
1,130 |
11,208 |
| South Australia |
1,612 |
1,195 |
297 |
349 |
3,453 |
| Tasmania |
634 |
474 |
124 |
154 |
1,386 |
| Victoria |
7,020 |
4,997 |
1,147 |
1,535 |
14,699 |
| Western Australia |
2,822 |
1,916 |
461 |
542 |
5,741 |
| Total |
25,972 |
18,869 |
4,541 |
5,477 |
54,859 |
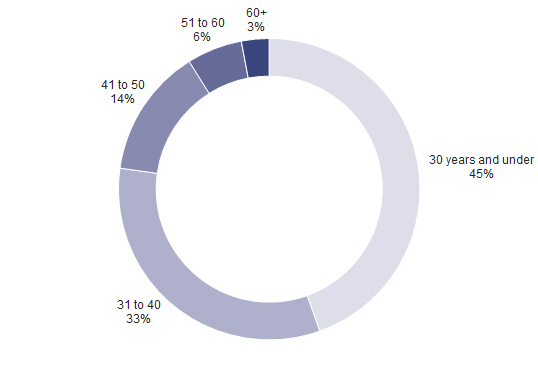
Age of registrants
Figure 1 provides a breakdown of registrants by age group.
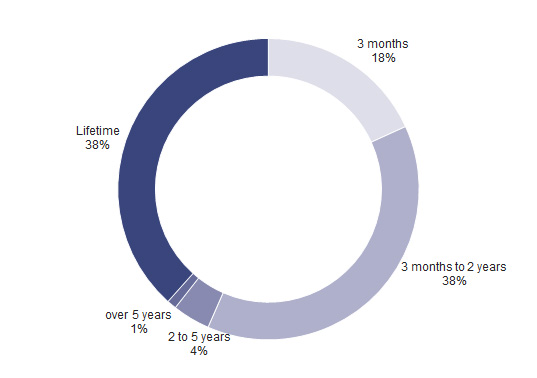
Exclusion periods
Figure 2 provides a breakdown of the length of exclusion that registrants have chosen.