On this page
Registrations
A breakdown by financial quarter and jurisdiction is displayed in Table 1.
Table 1: Registration summary
| Jurisdiction |
FY 23–24 |
Q1 24–25 |
Q2 24–25 |
Q3 24–25 |
Q4 24–25 |
Q1 25–26 |
Total |
|---|---|---|---|---|---|---|---|
| Australian Capital Territory |
405 |
91 |
56 |
55 |
58 |
62 |
727 |
| New South Wales |
8,055 |
1,482 |
1,618 |
1,376 |
1,467 |
1,485 |
15,483 |
| Northern Territory |
188 |
41 |
52 |
44 |
39 |
31 |
395 |
| Queensland |
5,236 |
904 |
1,061 |
924 |
1,019 |
934 |
10,078 |
| South Australia |
1,612 |
259 |
332 |
285 |
319 |
297 |
3,104 |
| Tasmania |
634 |
114 |
130 |
118 |
112 |
124 |
1,232 |
| Victoria |
7,020 |
1,173 |
1,389 |
1,218 |
1,217 |
1,147 |
13,164 |
| Western Australia |
2,822 |
457 |
540 |
430 |
489 |
461 |
5,199 |
| Total |
25,972 |
4,521 |
5,178 |
4,450 |
4,720 |
4,541 |
49,382 |
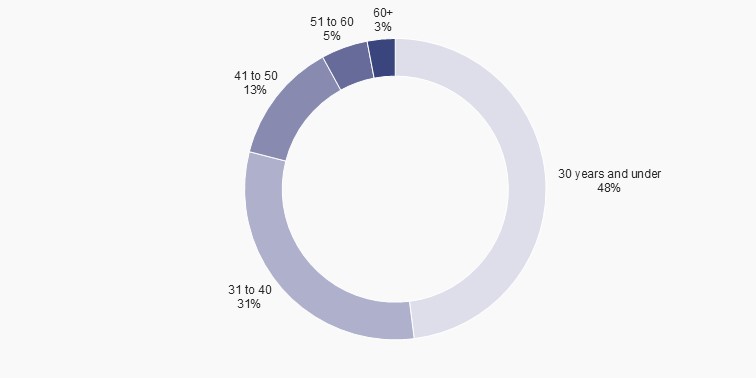
Age of registrants
Figure 1 provides a breakdown of registrants by age group.
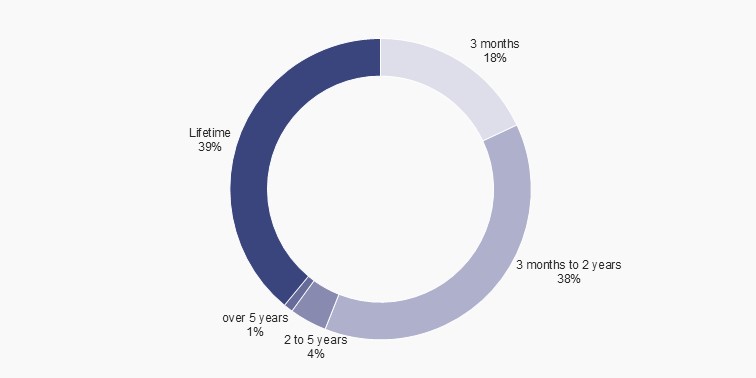
Exclusion periods
Figure 2 provides a breakdown of the length of exclusion that registrants have chosen.